Using TRPO to solve Driving Task around a Track
The Formula Student Challenge (link) is a competition where the idea is to build from zero a race car. One of its branches is autonomous driving, where the idea is to make the car drive itself around a track made of traffic cones. The usual solutions come from a classical approach made by Perception, Mapping and Planning subsystems. But we decided to solve the problem using End-to-End Reinforcement Learning as a course project.
Environment
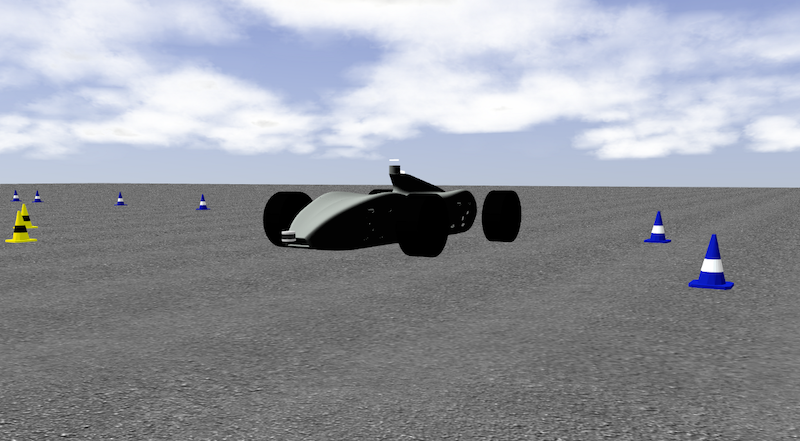
The environment is made using ROS and Gazebo simulation, where we have the model of the team’s car. The reason behind it is that we are interested in mimicking the same architecture used for our race car, therefore we have the same components in theory as the car in real life, in order to deploy the code to the car easier.

The agents are equipped with different sensors, mainly one Lidar and one stereo camera, but for this task, we decided to use only one monocular camera following the architecture of this paper (link). The tracks are made of yellow and blue traffic cones for each side of the track.
Summary
After getting Gazebo ready, building a gym API on top of it, exploring DDPG, PPO and TRPO, and several days of training, I managed to solve the problem environment. Given the time constraints we had, I decided to leave one action out of the equation, we removed one degree of freedom, we made acceleration constant and focused on learning a controller for steering. After recollecting around 130GB of logs just on experiments, I was able to get a RL model which learned an “optimal” policy capable of doing several laps around the track.
Conclusion
Although we didn’t get the full results we were expecting, we had to explore and learn so many things to get there, that we all were happy with the result. From there we have learned so many things and I am sure now, if we had to repeat this project, we will tweak it to get the right key aspects that we missed the first time.
Video
In the following video, you can see the environment from a top-view. To the left, the cost map function can be seen, and to the right the real-time observations of the agent as it advances on the track.
You can see the final report here